The politics behind some budget expenditures

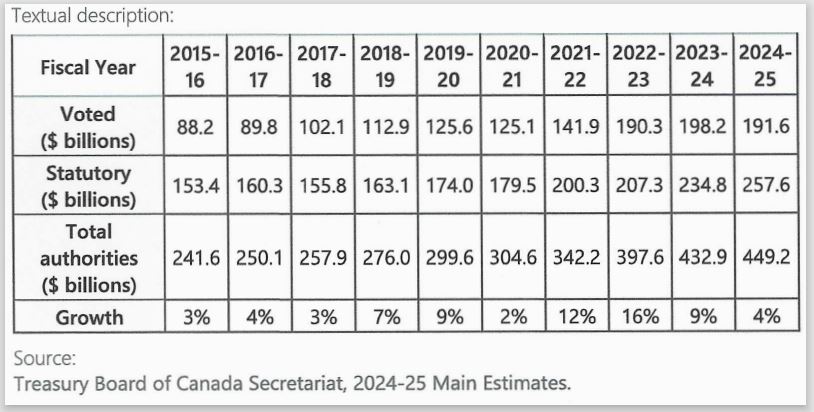
TORONTO – Much is being made of the spending by the current government in areas to achieve national objectives. The Annual “tabling of the Main Estimate” in Parliament usually starts the debate for what expenditures need to be approved by Parliament. It is a sizeable amount of money $449.2 billion, roughly 22% of GDP. It does not include annual expenditures by provinces, municipalities and others agencies with taxing powers.
Canada has Parliamentary Budget Officer (PBO) tasked with trying to make sense of the hundreds of pages of facts and figures presented by the federal ministries responsible for designing programs, proposing funding and ensuring Canadians get value for money. The PBO’s breakdown of the budget plan may help us understand how or why certain parties take the positions they do. For debates and announcements leading to the next federal election this may be useful or at list instructive.
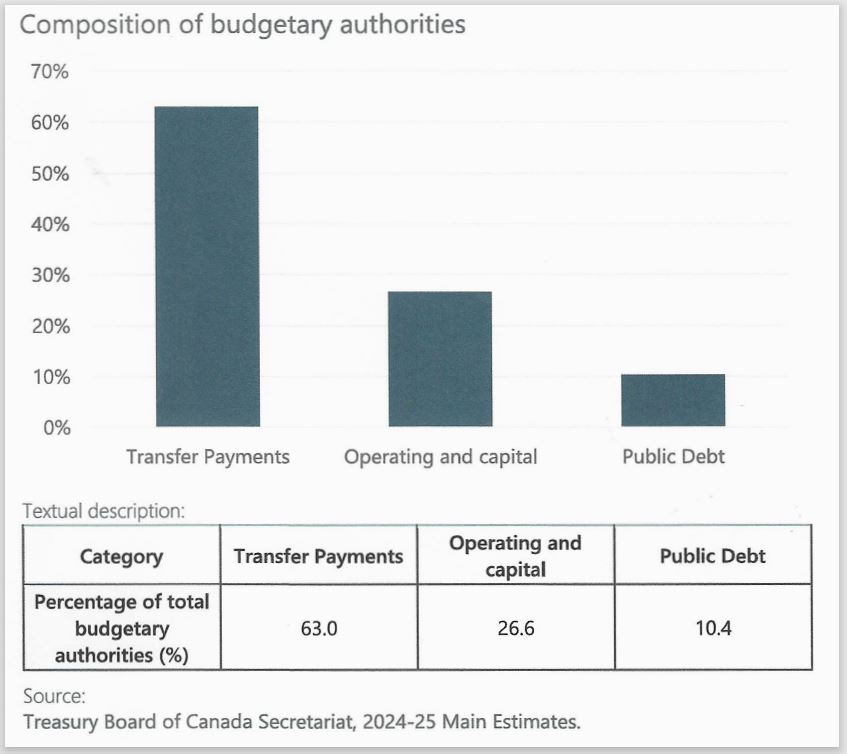
As a start, PBO divides all expenditures into three categories (see chart below) transfer payments, operating and public debt. The latter amount, so far, stands at $ 46.7 billion, what it costs to borrow the money the federal government spends – reduce this by spending less (in which areas?) and/or cause interest rate reductions.
This may not mean much but it indicates that every Canadian, no matter the age, essentially has to pay $1,167 per year – just in borrowing costs
Some of the monies being requested by Parliament are already committed to “Statutory obligations” known as transfers to provinces, individuals or other entities entitled to receive these transfers by law. As per the chart, 63% of the $449.2 billion fall into that category.
Among the “individuals” who are entitled to receive the transfer are the 7,520,000 Canadian Seniors (18.8% of our population). That number will grow as our population ages and our fertility and birth rates plummet. This year, Seniors are entitled to benefits (Old Age Security and Guaranteed Income Supplement) that will cost, on average $10,785 per recipient. Add to that another average c. $1,560 in pension benefits and one can begin to appreciate the competition for allocating whatever funds have not already been moved to the “transfer” designation. That sector is now only 26% of the total proposed. It must be “voted”, approved, in Parliament.
Looking at the second chart (below), provided by the PBO, which shows the three categories in the last ten years of Main Estimates, the reader might remark the marked growth in expenditures both as an absolute total and as a percentage year over year. The costs and percentage of total suggest a steep rise associated with allocations (tax expenditures) perhaps tied to coalition governments, for good or otherwise.